
If there’s something strange, broken, smelly or anti-social in your neighborhood, who you gonna call? That’s right: 3-1-1.
The 311 number and the 311-branded apps that some cities provide are intended as non-emergency contacts for city services. For example, the City of Fresno lists illegal trash dumping, potholes, street light issues and flooding among issues that neighbors can report through the service.
So, while some residents treat it as a helpline for life in general — New Yorkers have raised issues such as “Can you check if my boyfriend is married?” and, yes, “I’d like to report a ghost in my window” — the 311 service is best thought of a place to report neighborhood problems that are not serious enough for 911.
That makes it a pretty good way to measure the livability of a neighborhood when you’re planning a move. It’s probably for the best that 311 calls are private, but what we can measure is call volume: the number of 311 calls made as a proportion of the number of residents in a given city or zip code. So, we did just that — and we can now reveal the neighborhoods where residents complain the most about local issues.
KEY FINDINGS
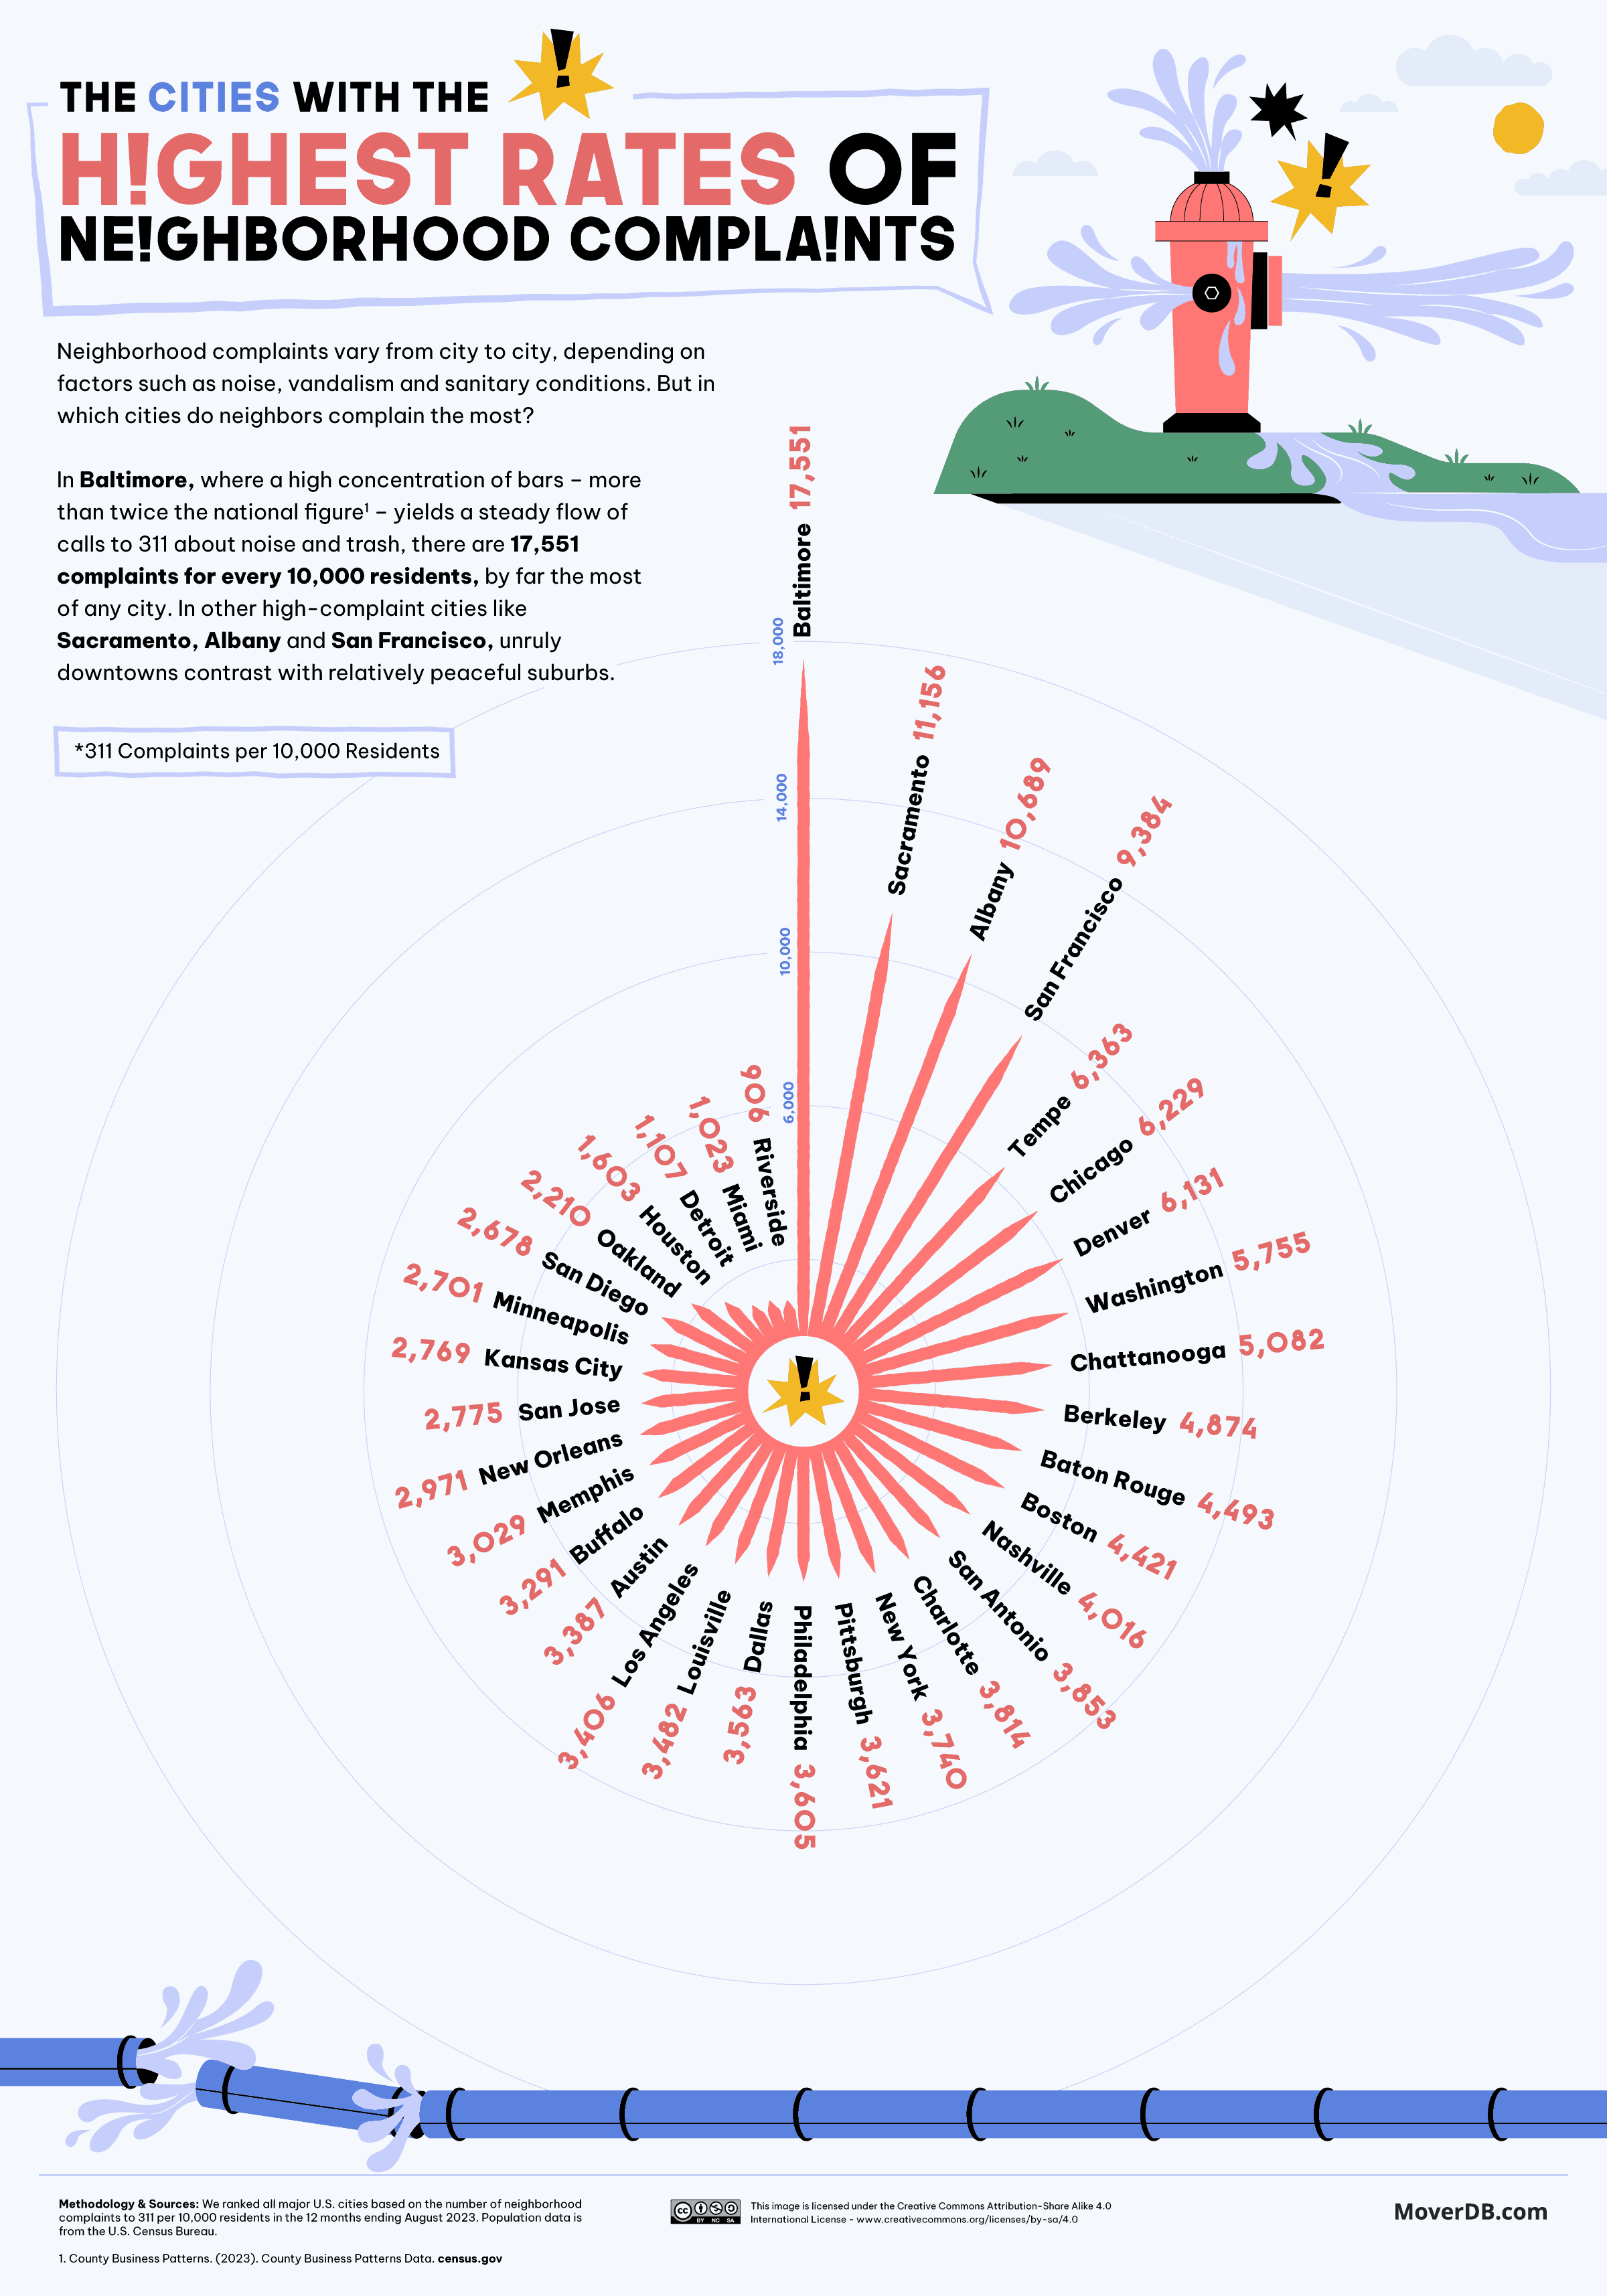
- Baltimore residents complain more about their neighborhood than residents of any other city, calling the 311 service 17,551 times per 10,000 residents per year.
- Riverside is the city where residents make the least complaints, just 906 per 10,000 residents.
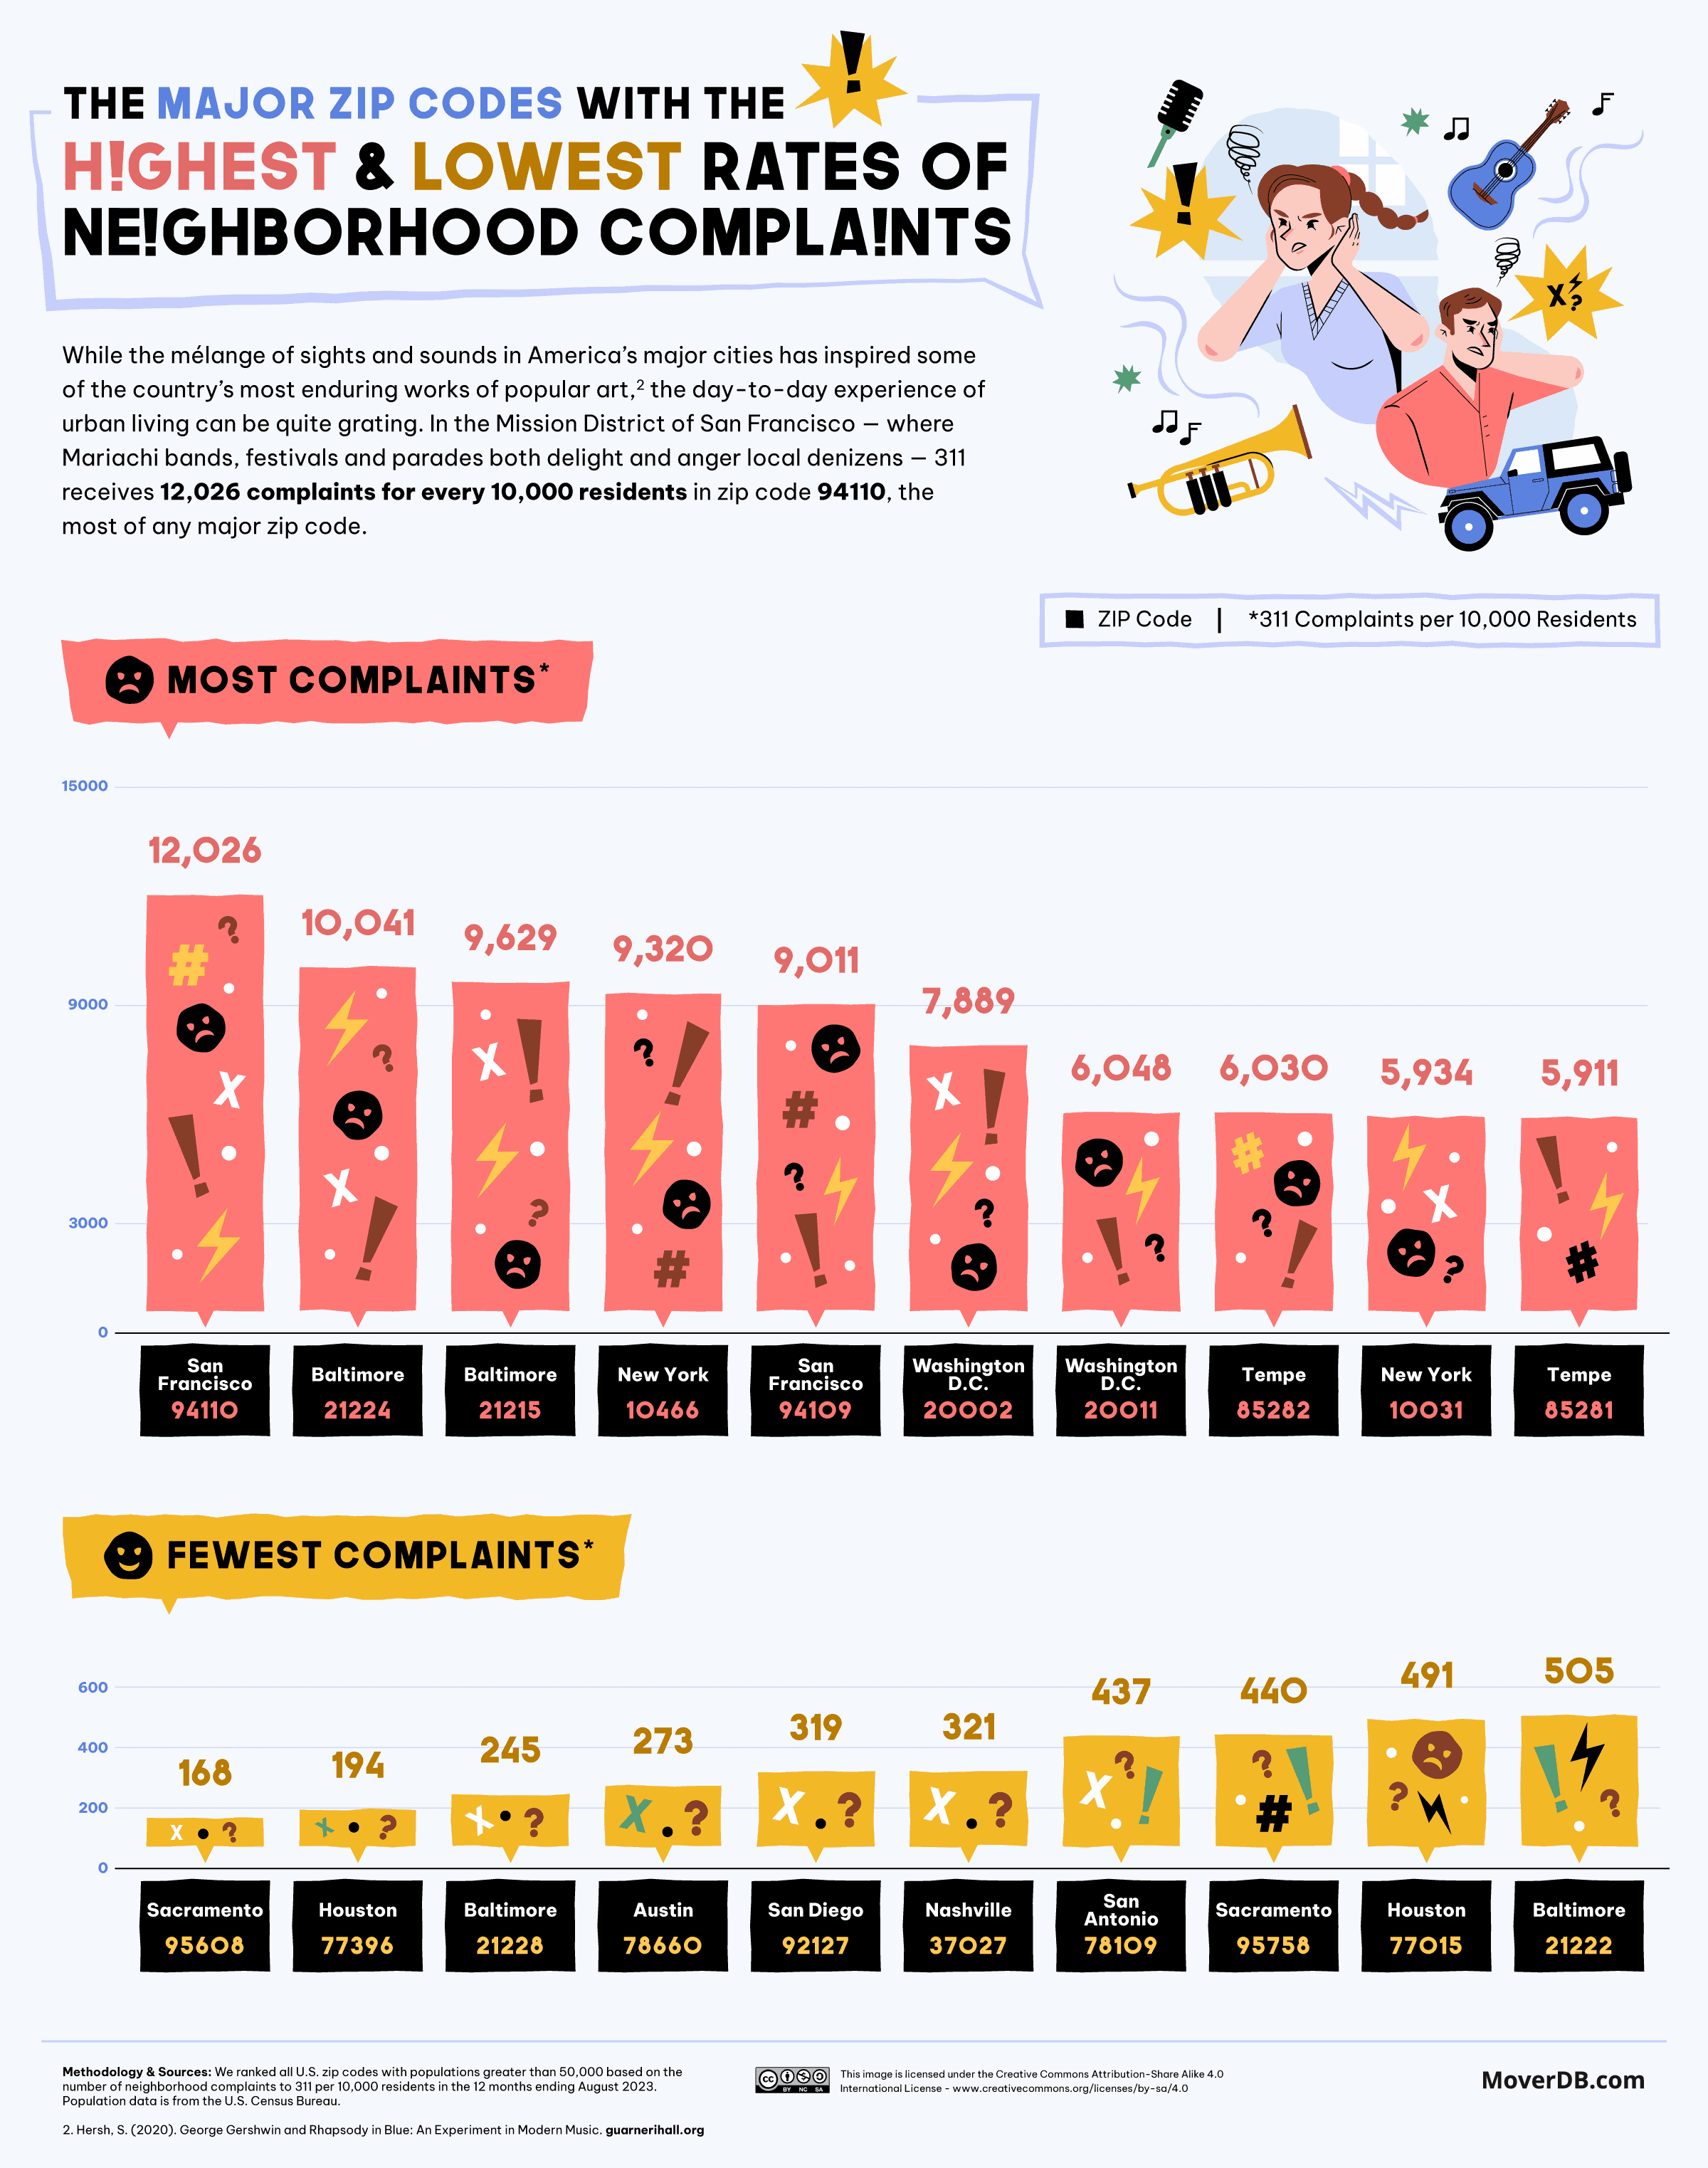
- San Francisco’s ZIP Code 94110, in and around the Mission District, is the most complained about neighborhood in the U.S., with 12,026 calls per 10,000 residents.
- Sacramento’s ZIP Code 95608, covering the town of Carmichael, is the least complained about neighborhood, with just 168 calls per 10,000 residents per year.
Baltimore — the First and Busiest of 311 Services
The city of Baltimore established the first 311 service as a non-emergency alternative to 911 on October 2, 1996, and the idea quickly spread across the U.S. and Canada. New York City alone has received over half a billion 311 reports since launching in 2003, of which 360 million (68.4%) came in as phone calls. We looked at the number of 311 calls made in each city over the past year before zooming in on the ZIP codes about which these calls were made.
Click here to see the image in full size
Baltimore started the first 311, and it remains the most popular — although that may not be a positive thing. It is one of just three cities (along with Sacramento and Albany) where there is more than one call per resident per year. In Baltimore’s case, the average resident makes 1.76 calls. A 2019 analysis revealed that, while issues raised in the Southeast of the city were almost always resolved within seven working days, calls from the Southwest almost always took longer. Some four out of ten calls were residents following up on previous calls.
The City of Sacramento encourages its residents to call 311 for any customer service request they have, including seeking information and setting up new services. This could explain why Sacramento ranks so high on this list.
Two Baltimore ZIP codes are among the three neighborhoods with the most complaints across the U.S. — although these are found in the Northwest of the city around Park Heights and the Southeast between Canton and Greektown.
Click here to see the image in full size
But the ZIP code where residents complain the most is San Francisco 94110: the Mission District. The most common complaints in SF are about uncollected trash and dumped bulky items.
“Yeah, sure, it should be the city’s job, but … why wait for an official solution to come?” asks James Thompson, who founded the community clean-up group Clean Streets on his Mission District block, from which it grew to cover other areas. “The pandemic had just really taken root, and things were all closed. And, in those early months, the city stopped doing any kind of street sweeping at all. And so the litter problem got really, really bad in the neighborhood.”
Fresh Meadows is NYC’s Busiest ZIP Code for 311
Click here to see the image in full size
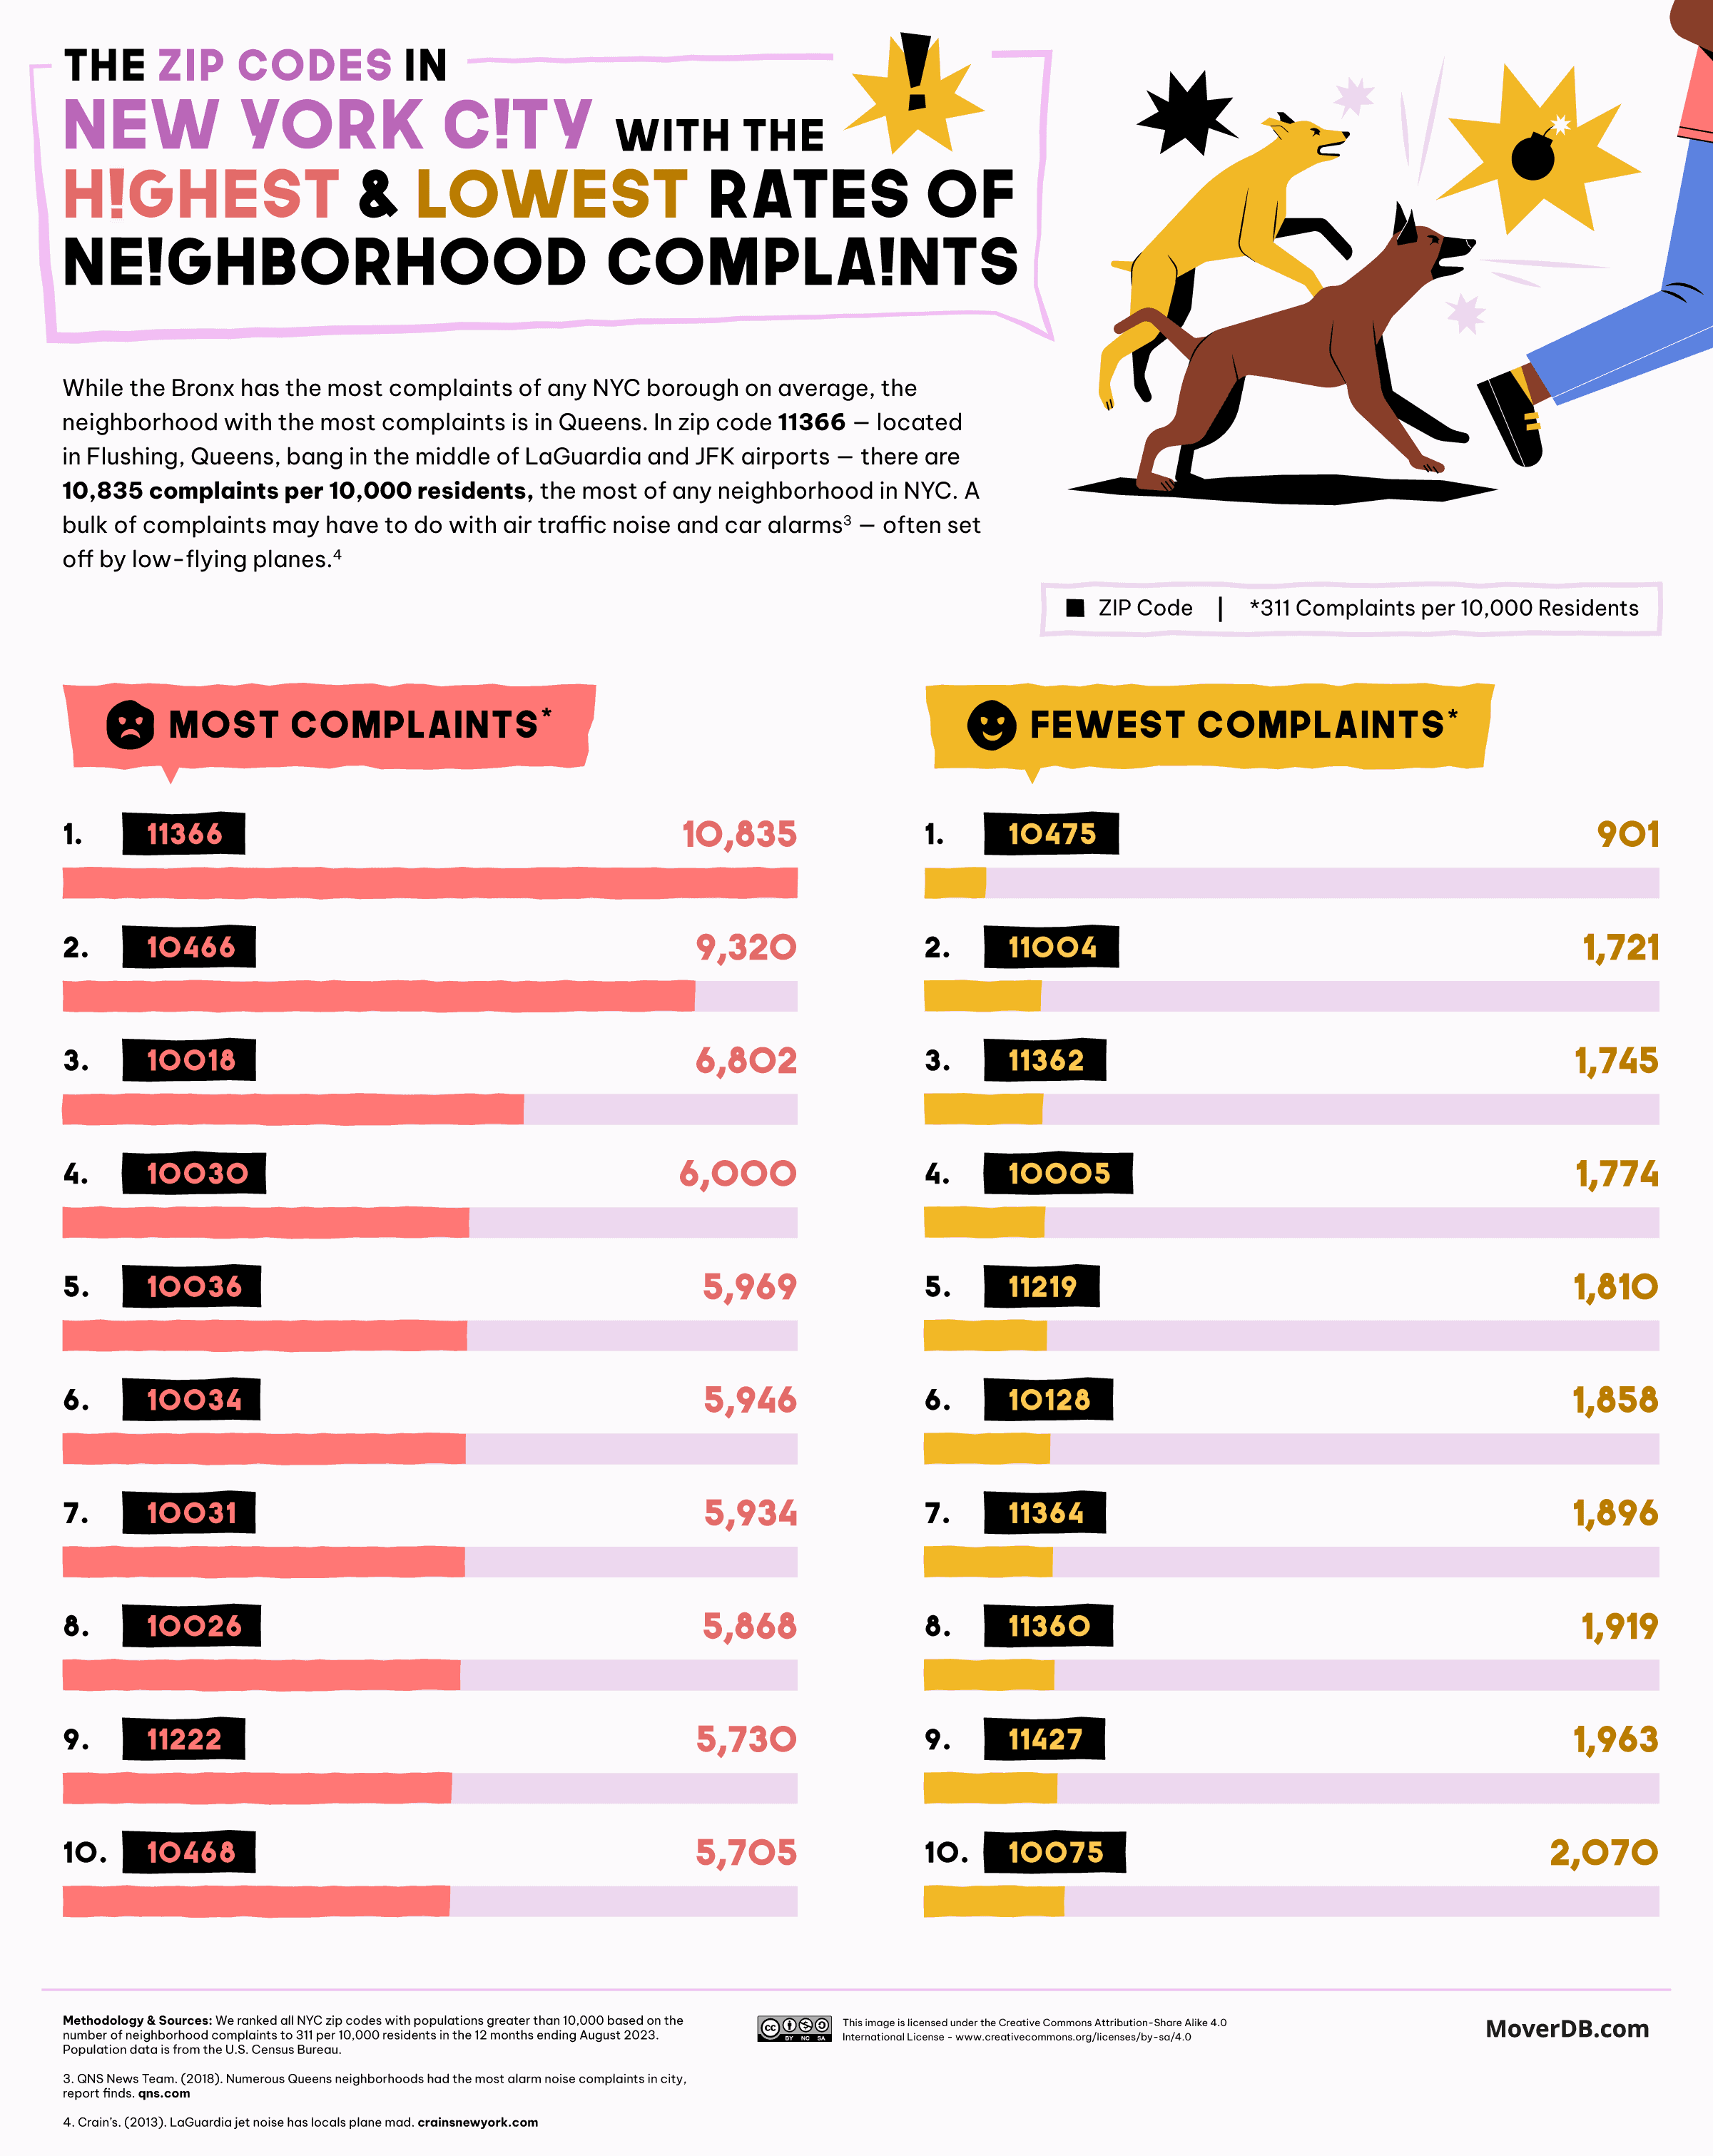
Just one NYC ZIP code manages to file more than one complaint per person per year: the Fresh Meadows neighborhood of Queens. The noise levels in the neighborhood have caused many a local to pick up the phone since, in addition to being on the flight path, locals must deal with the noise of rampant drag racing. The least troublesome area is the Co-op City neighborhood of the Bronx. As a cooperative housing development, residents are encouraged to resolve issues internally, particularly since complaining to 311 can attract unwanted attention from the City.
90210 is Home to LA’s Second Most Satisfied Residents
Click here to see the image in full size
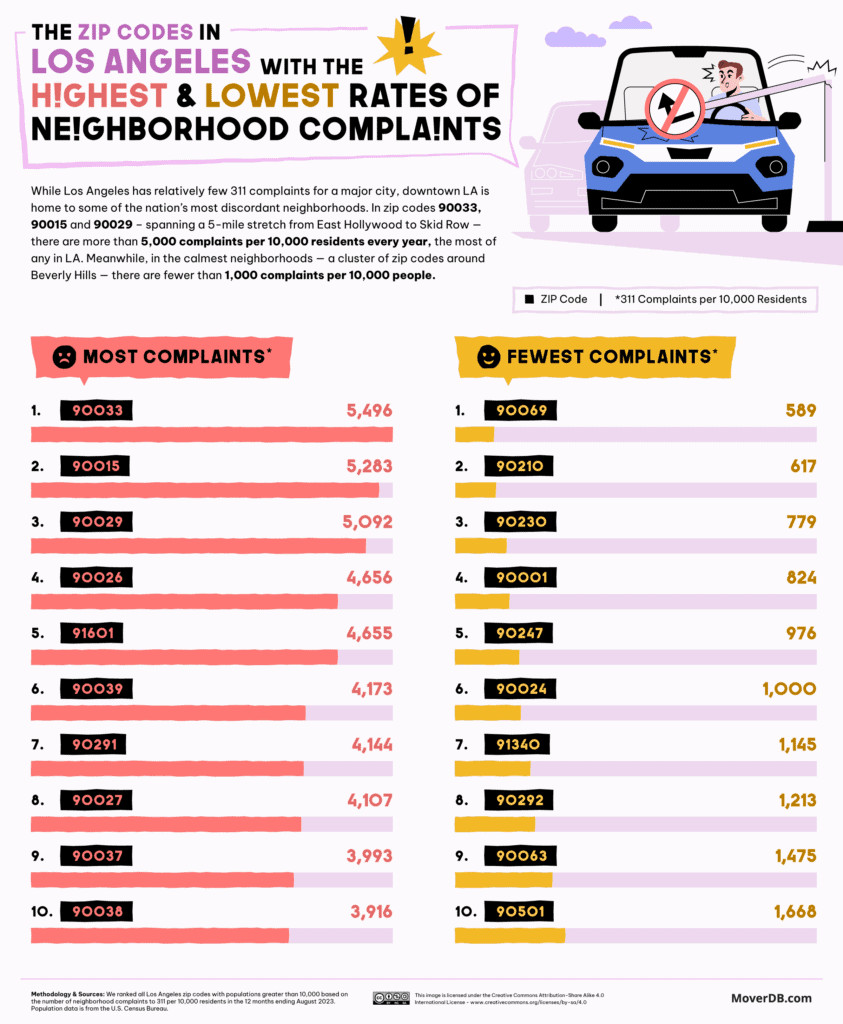
The Boyle Heights neighborhood, east of Downtown, is LA’s worst area for resident complaints. Thousands of Boyle Heights residents call in complaints about graffiti every year, while ABC7 points out that the neighborhood is at the meeting point of several freeways — “where all kinds of trash accumulates.” The second quietest 311 line is in perhaps LA’s most famous ZIP code: 90210, which gave its digits to the eponymous 1990s teen show and where maintenance of reputation goes hand in hand with maintenance of the streets.
Forest Glen/Jefferson Park Areas Require Most Attention in Chicago
Click here to see the image in full size
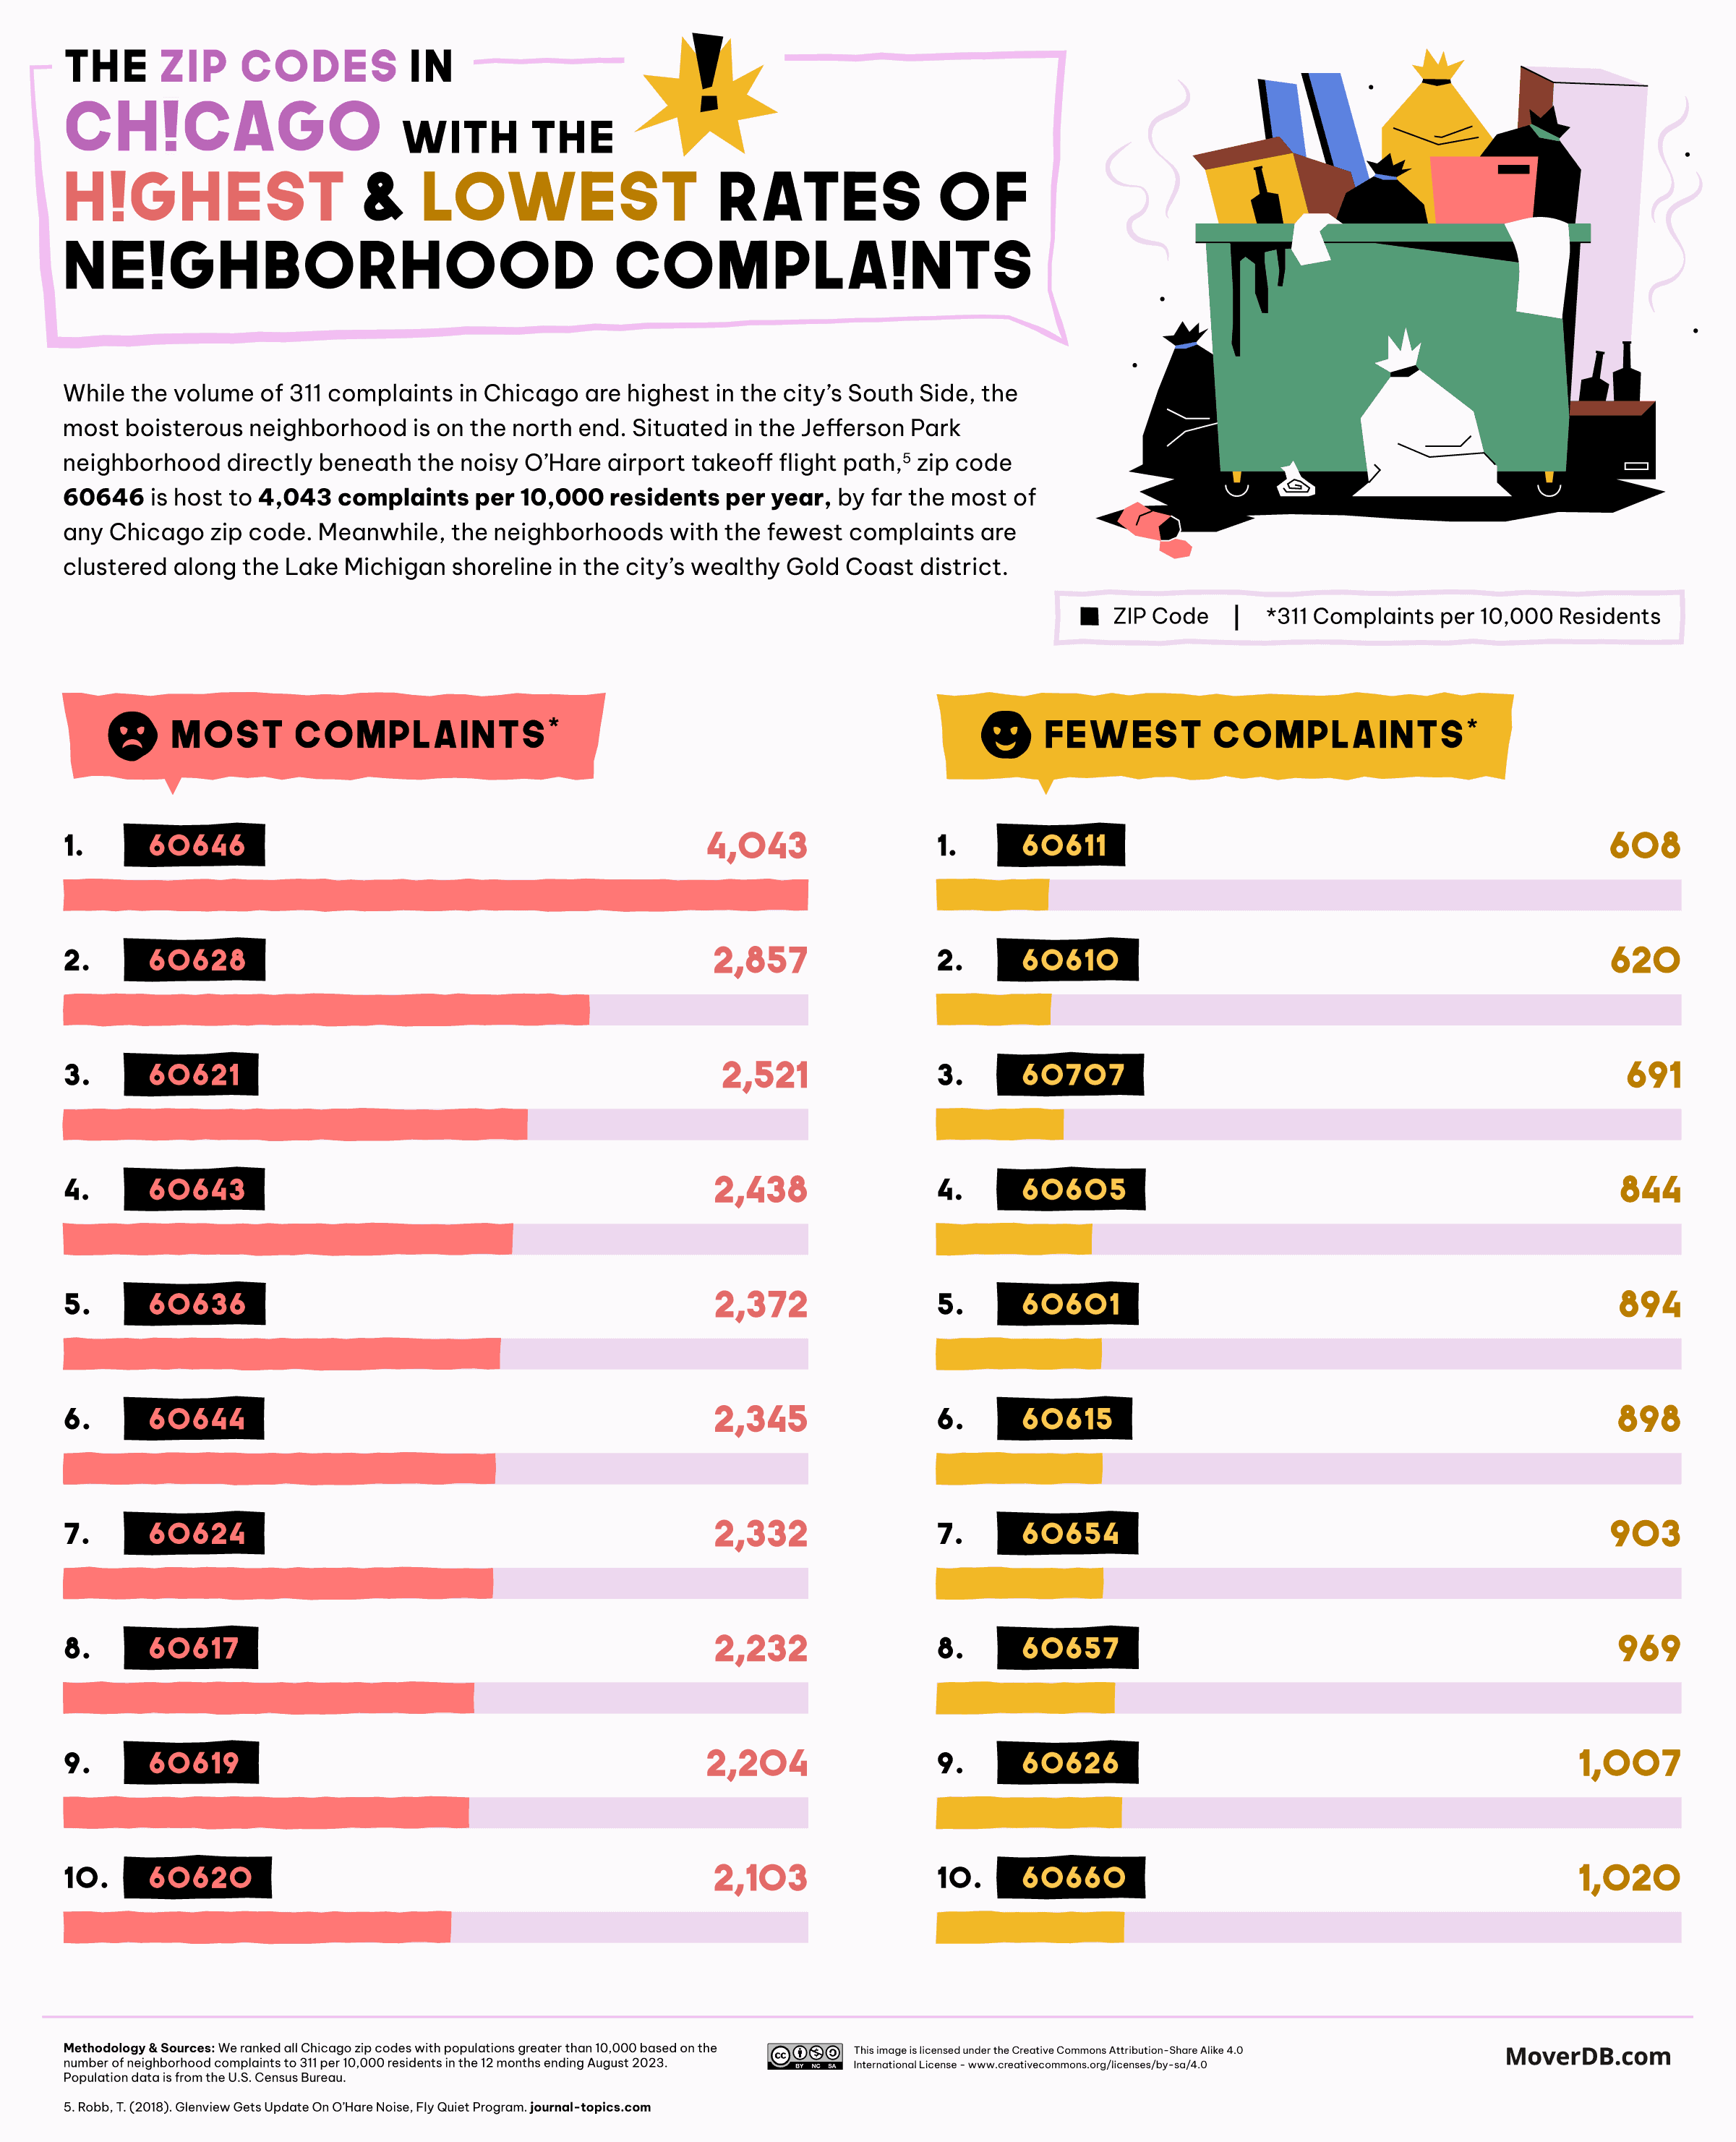
The Forest Glen area of Chicago makes 41.5% more calls to 311 than the second-placed neighborhood of Roseland and Pullman. In addition to its vast areas of park and woodland, the Forest Glen area has seen dense redevelopment projects in recent years. There is also some overlap with the Jefferson Park area, which is so directly in the flight path that a wheel from a passing plane once landed in a local garden.
Houston (Allegedly) Has A 311 Discrimination Problem
Click here to see the image in full size
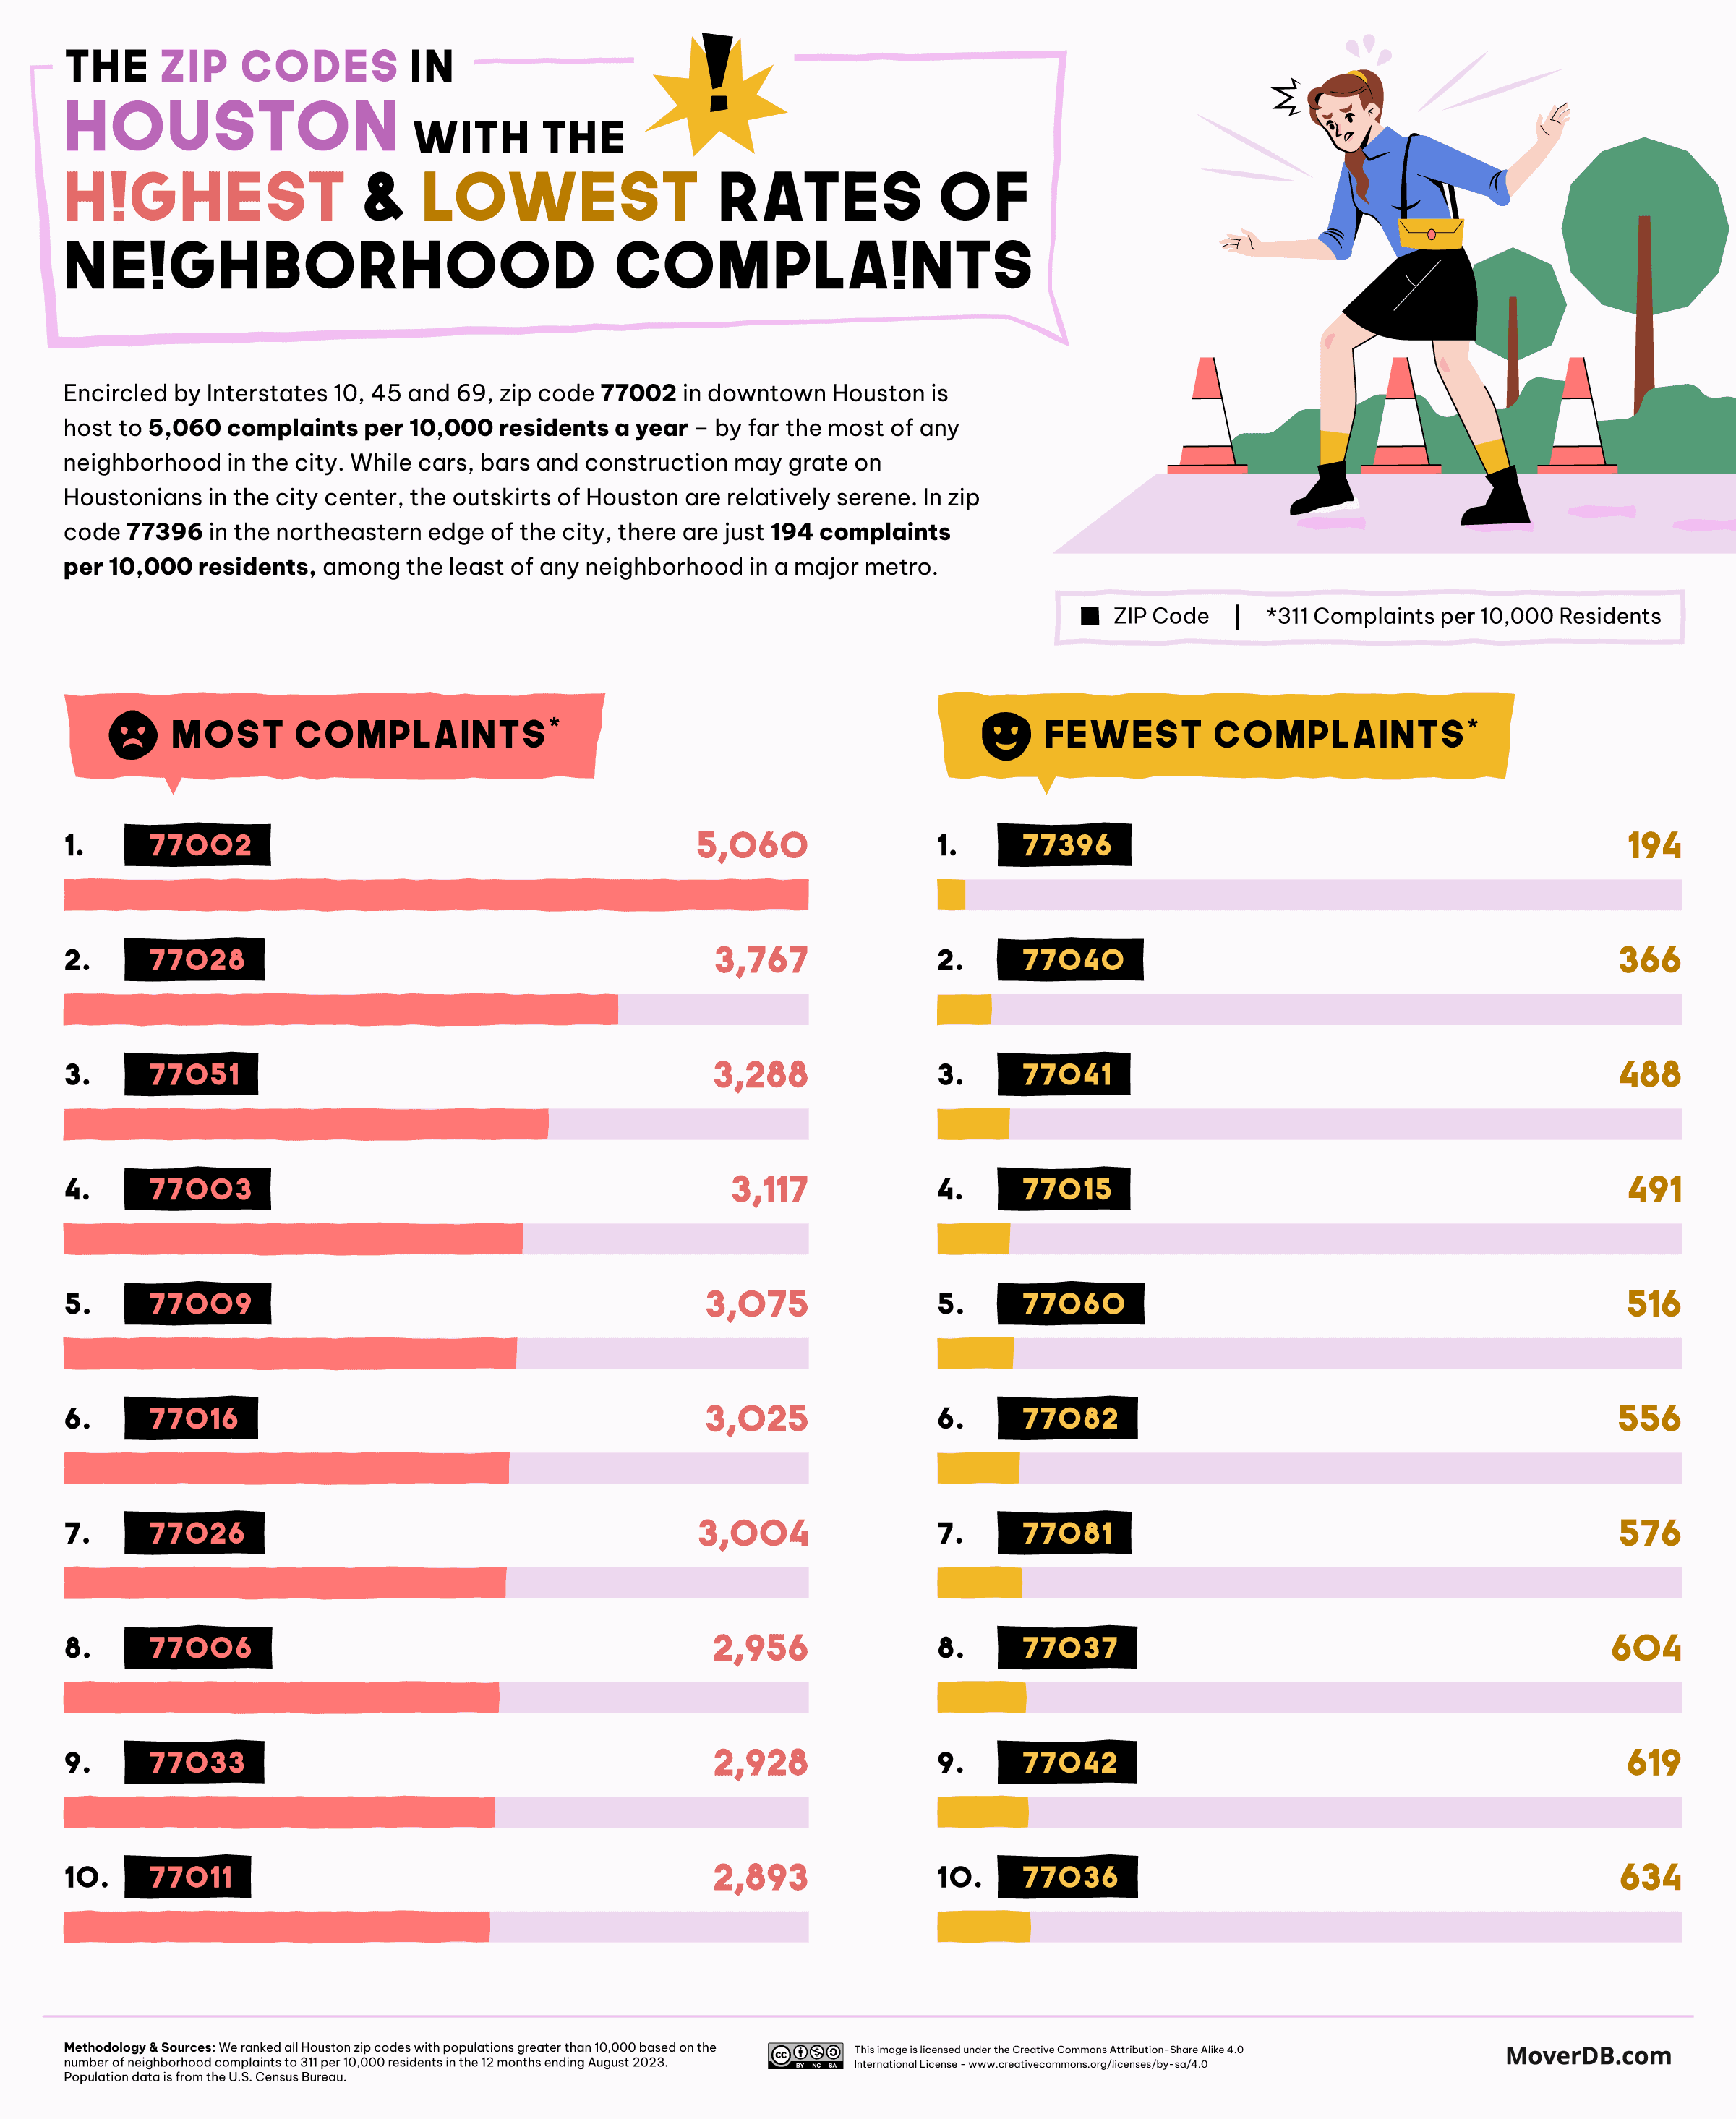
Downtown Houston is the city’s worst area for resident complaints by a considerable margin. Nearly 20,000 people live in this busy area. The second-worst 77028, as well as top-ten ZIPs 77016 and 77026, integrate the Trinity-Houston Gardens neighborhood, which was at the center of a controversy last year after accusations that the 311 service responded more slowly to the area’s predominantly Black and Hispanic inhabitants more slowly than white citizens elsewhere. “We look forward to working with the Civil Rights Division to ensure the City of Houston is in compliance with its federal civil rights obligations,” said U.S. Attorney Jennifer B. Lowery for the Southern District of Texas.
The Philadelphia Districts Lined with Abandoned Cars and Feuding Neighbors
Click here to see the image in full size
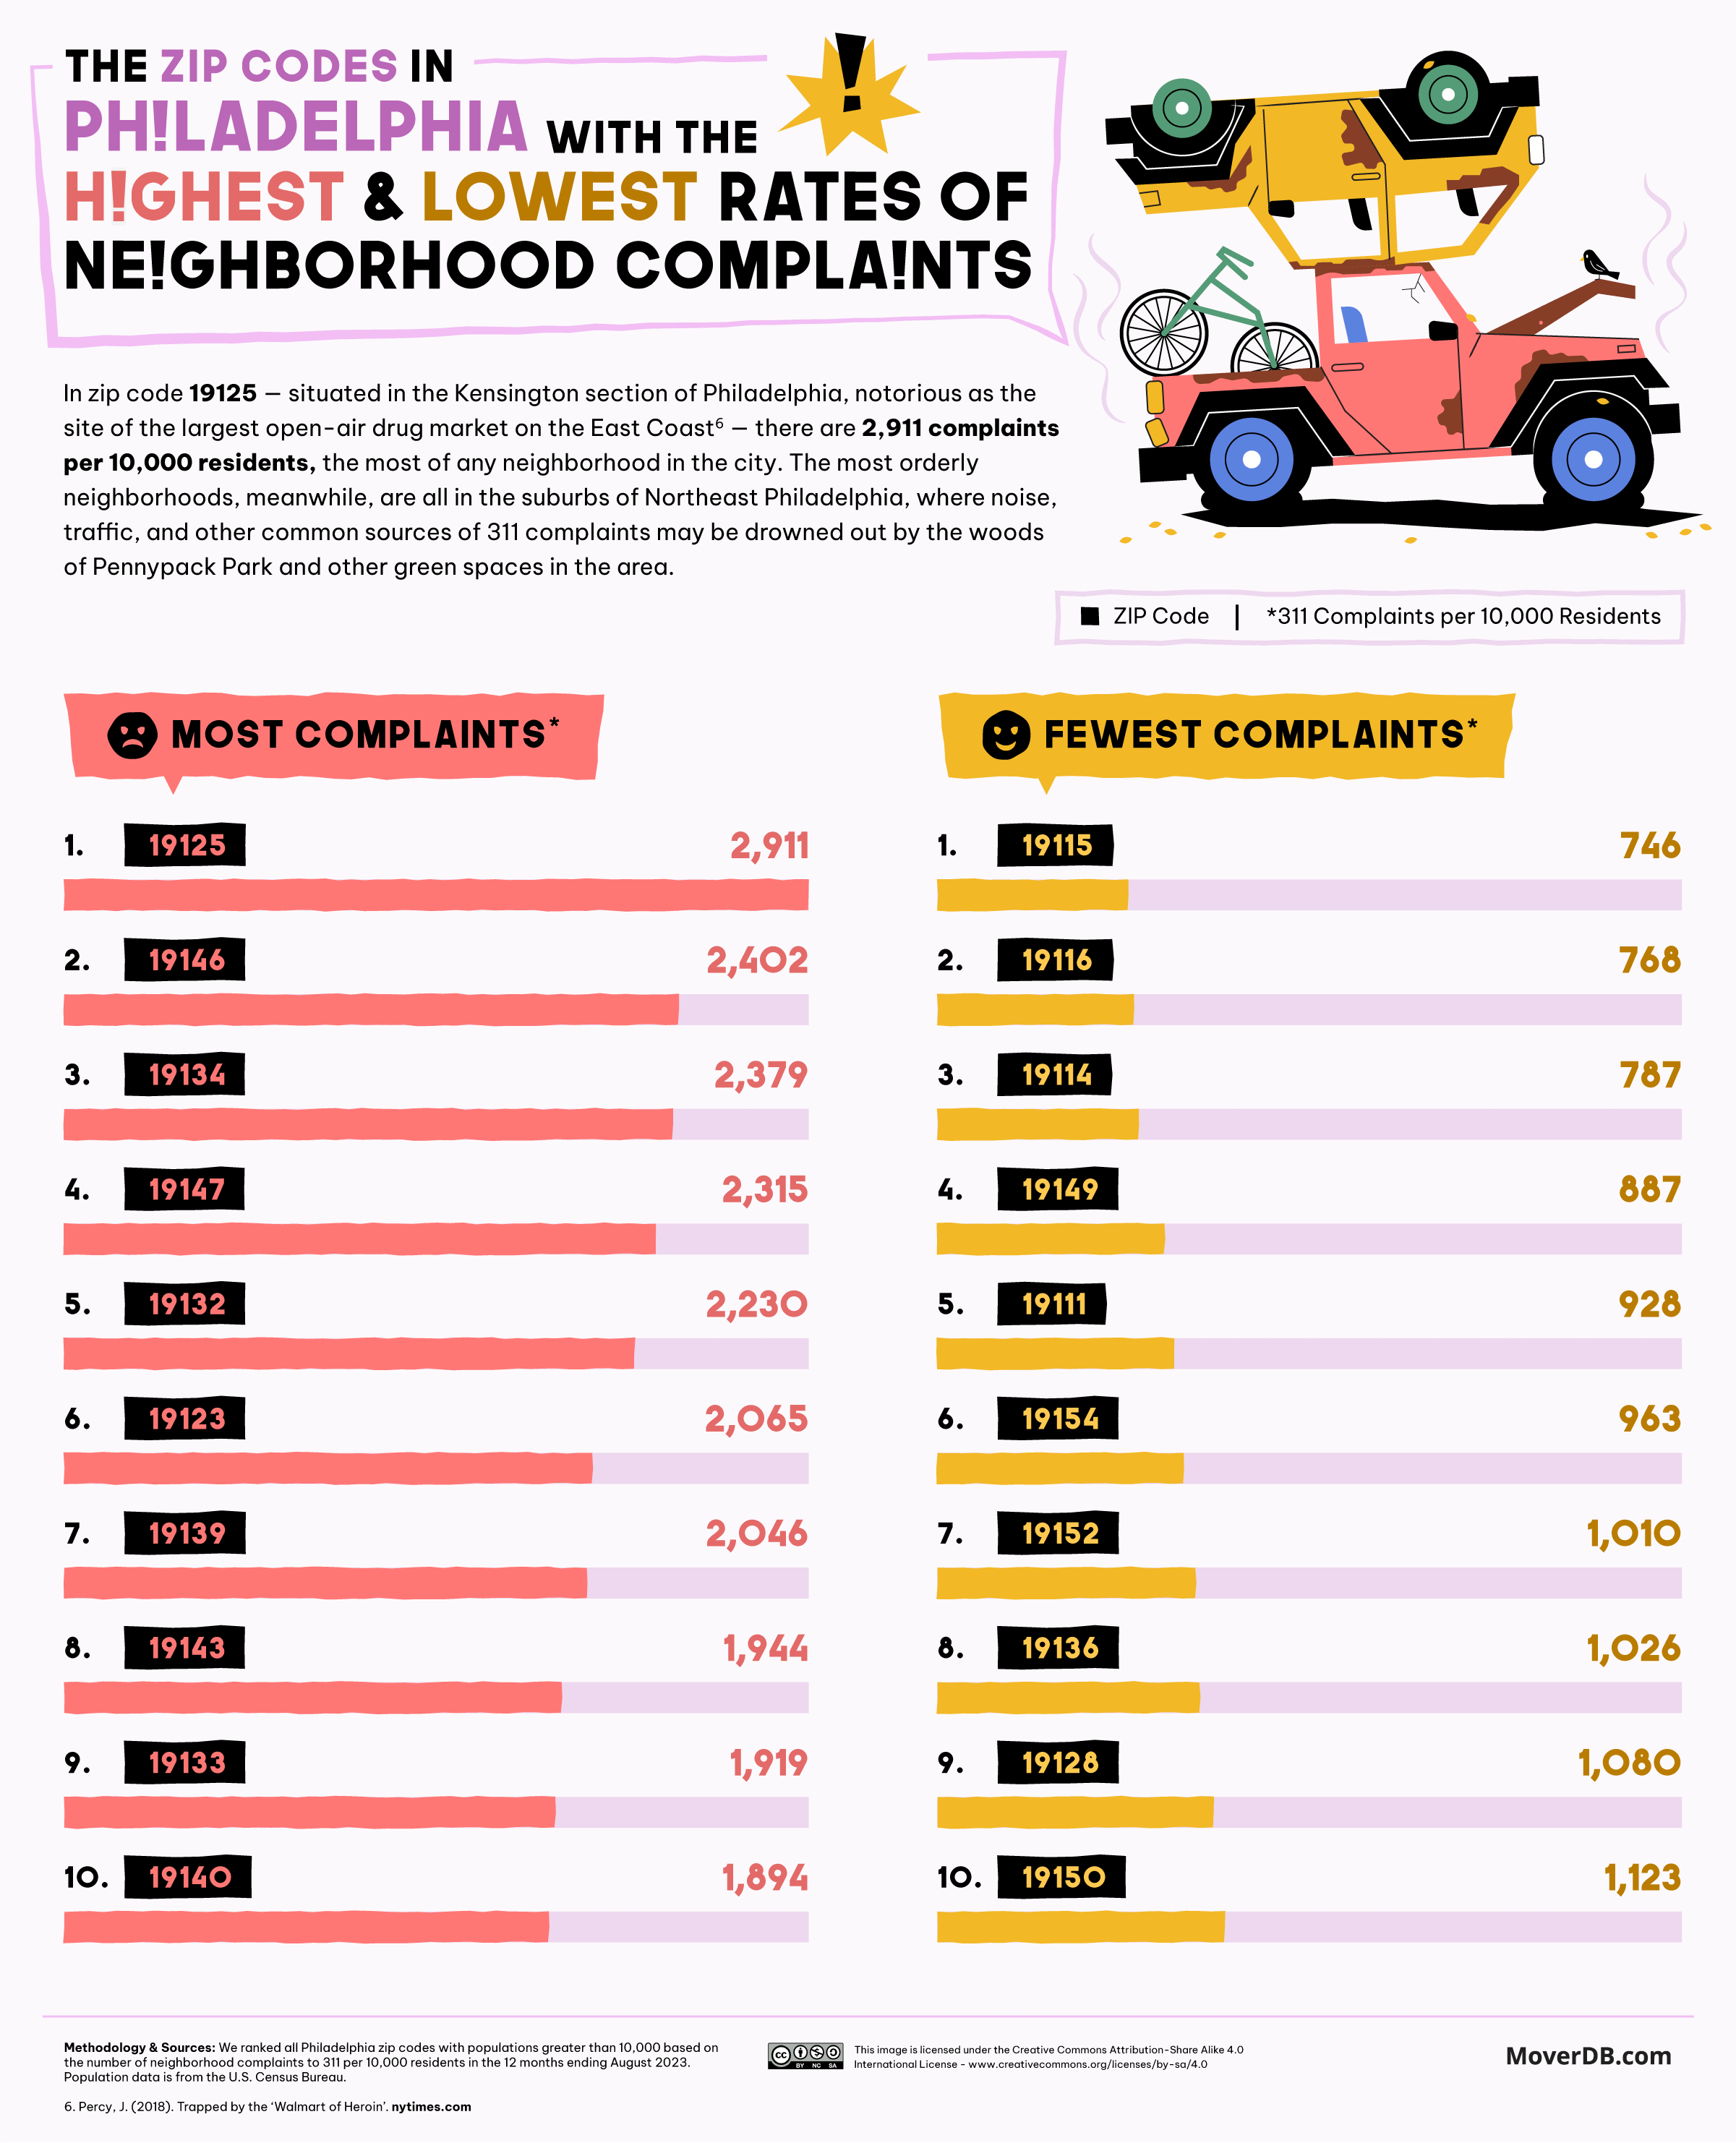
The Philadelphia residents who make the most complaints make significantly fewer calls than those in the other cities that we’ve focused on. Abandoned vehicles seem to be the main gripe, to the extent that a recent city budget allocated $2 million to tow abandoned vehicles. The Fishtown and Kensington neighborhoods attract the most complaints, with the fast gentrification of the area feeding culture clashes — such as barbeques, anti-social or otherwise — between residents old and new.
Calling it Quits
Cities sell their 311 services as the friendly face of the municipality, aware that callers are also voters, easily turned off by lingering neighborhood issues. But with some areas facing greater problems — and, allegedly, less preferential treatment — call numbers can swell despite the best intentions of the callers and the harried souls of the 311 service centers.
Do check our full data on 311 call volume in the interactive table below, and take a closer look at the response rate and neighborhood issues of areas where you’re thinking of moving if their numbers are especially high.
| METHODOLOGY To discover the cities and zip codes where residents complain the most about neighborhood issues (such as abandoned vehicles, noise, graffiti), we accessed 311 data for major U.S. cities. Zip codes with over 10,000 residents were ranked based on the number of complaints per 10,000 residents in the 12 months ending August 2023. Population data used to adjust noise complaint counts per capita came from the U.S. Census Bureau. |
Additional Sources
- United States Census Bureau. (2023). County Business Patterns Data. census.gov
- Hersh, S. (2020). George Gershwin and Rhapsody in Blue: An Experiment in Modern Music. guarnerihall.org
- QNS News Team. (2018). Numerous Queens neighborhoods had the most alarm noise complaints in city, report finds. qns.com
- Crain’s. (2013). LaGuardia jet noise has locals plane mad. crainsnewyork.com
- Robb, T. (2018). Glenview Gets Update On O’Hare Noise, Fly Quiet Program. journal-topics.com
- Percy, J. (2018). Trapped by the ‘Walmart of Heroin’. nytimes.com
Leave a Reply